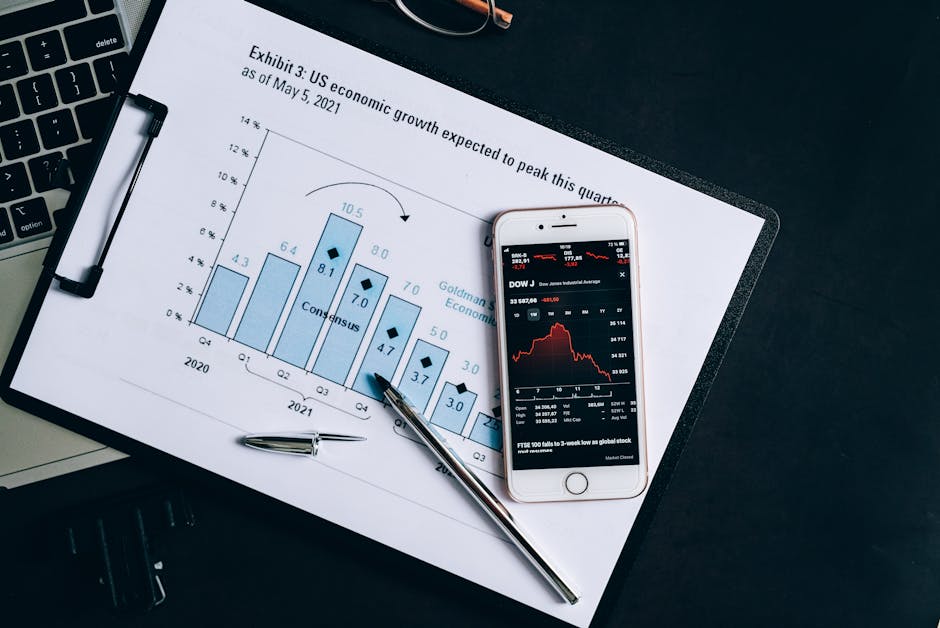
The Bureau of Economic Analysis released its advance estimate of third quarter 2026 Gross Domestic Product on October 29, providing the first comprehensive read on the pace of economic expansion during the July-through-September period. The report showed real GDP increasing at a seasonally adjusted annualized rate of 2.1 percent, a figure that confirmed the continuation of the resilient economic expansion that has defied recession predictions throughout the current monetary policy tightening cycle. For mortgage market participants and housing economists, the GDP report is a critical input into the assessment of whether the economy is on track for the soft landing that the Federal Reserve has been attempting to engineer, or whether the cumulative weight of restrictive interest rates is finally beginning to produce a more meaningful slowdown.
The headline GDP growth figure of 2.1 percent annualized came in slightly below the consensus expectation of economists, who had forecast growth of approximately 2.4 percent, and represented a modest deceleration from the 2.5 percent annualized growth recorded in the second quarter and the 3.0 percent growth in the first quarter of 2026. The deceleration is consistent with the narrative of a gradually cooling economy rather than an abrupt contraction, and the figure remains above the approximately 1.8 percent rate that most Federal Reserve officials and private forecasters consider the long-run potential growth rate of the U.S. economy. Growth above potential suggests that the economy continues to operate with a modest degree of excess demand, which is relevant to the inflation outlook and to the committee's policy deliberations.
Consumer spending, which accounts for approximately 70 percent of GDP, continued to be the primary engine of growth in the third quarter, contributing approximately 1.4 percentage points to the headline figure. Personal consumption expenditures increased at a 2.0 percent annualized rate, with spending on services growing faster than spending on goods, consistent with the ongoing rebalancing of consumer demand toward the pre-pandemic composition. Within services, spending on health care, recreation, and transportation services showed particular strength, reflecting the continued normalization of activity in these sectors. Within goods, spending on motor vehicles and parts was a notable drag, reflecting the softness in the auto market that has persisted amid elevated borrowing costs and the gradual normalization of vehicle prices from their pandemic-era peaks.
Business investment, captured in the gross private domestic investment component, contributed positively to third quarter growth, with nonresidential fixed investment increasing at a 3.2 percent annualized rate. Within business investment, spending on equipment increased modestly, while spending on intellectual property products, which includes software, research and development, and entertainment and literary originals, continued to grow at a robust pace, reflecting the ongoing investment in technology and innovation that has been a structural feature of the business investment landscape. Structures investment, which includes commercial and industrial construction, was roughly flat, reflecting the headwinds facing commercial real estate and the elevated cost of construction financing in the current interest rate environment.
Government spending contributed approximately 0.4 percentage points to third quarter GDP growth, with federal government consumption and investment increasing and state and local government spending also expanding. Federal defense spending was a notable contributor, reflecting the elevated pace of military procurement that has characterized the budget in recent years. State and local government spending was driven by ongoing investment in infrastructure, supported by the federal funding that has been flowing to state and local projects under the infrastructure legislation enacted in prior years. The government sector's contribution to growth, while modest, is a consistent feature of the current expansion and reflects the degree to which fiscal policy has been working in a supportive direction even as monetary policy has been restrictive.
Net exports subtracted approximately 0.2 percentage points from third quarter GDP growth, as imports increased faster than exports. The trade deficit widened modestly during the quarter, reflecting the strength of domestic demand, which pulls in imports, and the softness of global demand, which constrains export growth. The strength of the U.S. dollar, driven by the Federal Reserve's relatively hawkish stance compared to other major central banks, has also contributed to the trade dynamic by making U.S. exports more expensive in foreign markets and imports cheaper for domestic consumers. The global economic environment, characterized by sluggish growth in Europe and the ongoing structural adjustments in the Chinese economy, has limited the demand for U.S. exports and is expected to continue to be a modest drag on growth.
The change in private inventories subtracted approximately 0.3 percentage points from third quarter GDP growth, as businesses drew down their inventories at a faster pace than in the prior quarter. Inventory investment is the most volatile component of GDP and can swing significantly from quarter to quarter, often producing misleading signals about the underlying trend in economic activity. The inventory drawdown in the third quarter may reflect deliberate destocking by businesses that are managing their inventory levels conservatively amid uncertainty about the demand outlook, or it may simply reflect the normalization of inventory levels after the accumulation that occurred in earlier periods. The inventory contribution will be revised in the second and third GDP estimates, and the direction of the revision could meaningfully alter the headline growth figure.
The inflation measures embedded in the GDP report provide an important complement to the Consumer Price Index and Personal Consumption Expenditures data that are released separately. The GDP price index, which is the broadest measure of inflation in the economy, increased at a 2.0 percent annualized rate in the third quarter, down from 2.4 percent in the second quarter and consistent with the broader disinflationary trend. The Personal Consumption Expenditures price index, which is the Federal Reserve's preferred inflation measure and is calculated within the GDP report, increased at a 1.8 percent annualized rate, while the core PCE price index increased at a 2.1 percent annualized rate. These readings are consistent with the convergence of inflation toward the 2 percent target that the separate monthly PCE reports have been showing.
The income side of the national accounts, which calculates Gross Domestic Income as an alternative measure of economic activity, provides a useful cross-check on the GDP figure. In theory, GDP and GDI should be equal, as they represent two different approaches to measuring the same economic activity, but in practice they diverge due to differences in data sources and measurement methodologies. The advance GDI estimate for the third quarter showed income growing at a 2.4 percent annualized rate, modestly faster than the GDP estimate, which is consistent with the historical pattern in which GDI has tended to grow faster than GDP during periods of economic resilience. The average of GDP and GDI, which is considered by some economists to be a more reliable measure of true economic growth, was approximately 2.25 percent for the quarter.
The interest-sensitive sectors of the economy, which are most directly affected by the Federal Reserve's restrictive monetary policy, showed the expected softness in the third quarter. Residential fixed investment, which includes the construction of new single-family and multifamily housing as well as brokers' commissions and other ownership transfer costs, declined modestly, reflecting the ongoing drag from elevated mortgage rates on housing market activity. The decline in residential investment is consistent with the broader narrative of the housing market operating under the constraint of high borrowing costs, with both construction activity and existing home sales suppressed relative to their levels in a lower-rate environment. The residential investment sector has been the most consistently interest-sensitive component of GDP throughout the current cycle.
The labor market connection to the GDP report is an important dimension of the analysis, as the pace of economic growth determines the demand for labor and, consequently, the trajectory of employment and wage growth. A GDP growth rate of 2.1 percent is consistent with a labor market that is adding jobs at a moderate pace, sufficient to absorb new entrants to the labor force and maintain a low but gradually rising unemployment rate. The relationship between GDP growth and employment growth is captured in Okun's Law, which suggests that GDP growth of approximately 2.0 percent is consistent with a stable unemployment rate, and growth above that level is associated with a declining unemployment rate. The third quarter growth figure is right at this threshold, consistent with the broadly stable but gradually cooling labor market that the employment data has been showing.
The implications of the third quarter GDP report for the Federal Reserve's policy deliberations are nuanced and depend on how the committee weighs the growth data against the inflation and labor market data. A GDP growth rate of 2.1 percent, running modestly above the estimated potential growth rate, suggests that the economy is not weakening to a degree that would demand an urgent policy response to support employment. At the same time, the inflation measures within the GDP report confirm the disinflationary trend, and the combination of moderating inflation, cooling but functional labor markets, and resilient but moderating growth is precisely the configuration that the committee has been seeking as the precondition for beginning to reduce the restrictiveness of monetary policy. The report supports the soft-landing narrative.
The recession probability discussion that has accompanied the GDP reports throughout the current cycle deserves attention in the context of the third quarter data. Throughout the tightening cycle, a range of recession probability models, including the Federal Reserve Bank of New York's yield curve recession probability model and the Sahm Rule recession indicator, have been signaling elevated recession risk. The inversion of the Treasury yield curve, which has persisted for an extended period, is historically one of the most reliable recession predictors. However, the economy has continued to expand, defying the recession signals and raising questions about whether the current cycle will prove to be an exception to the historical pattern or whether the recession signal is simply operating with a longer lag than in past cycles. The third quarter growth figure provides further evidence that any recession, if it materializes, has been significantly delayed.
The comparison of the third quarter growth figure to the broader trend of the current expansion provides additional context. Since the recovery from the pandemic recession began in mid-2020, the U.S. economy has grown at an average annualized rate of approximately 2.4 percent, with significant variation across quarters. The third quarter 2026 figure of 2.1 percent is slightly below this average but within the range of normal variation. The consistency of growth in the 2.0 to 3.0 percent range over recent quarters, despite the restrictive monetary policy stance, is a testament to the underlying resilience of the expansion and to the supportive role that fiscal policy, household balance sheets, and business investment have played in sustaining economic activity even as monetary policy has been working in the opposite direction.
This analysis of the third quarter 2026 Gross Domestic Product report is based on the advance estimate released by the U.S. Bureau of Economic Analysis on October 29, 2026. The advance estimate is the first of three estimates that the BEA will release for the quarter, with the second estimate scheduled for late November and the third estimate for late December. GDP estimates are subject to meaningful revision as more complete source data becomes available, and the final estimate can differ from the advance estimate by several tenths of a percentage point. This article is for informational and educational purposes only and does not constitute financial advice or a prediction of future economic conditions or Federal Reserve policy actions. Borrowers and investors should consult qualified financial professionals for guidance specific to their individual circumstances.

Have Questions About Your Mortgage Options?
Speak with Ebonie Beaco, Senior Mortgage Loan Officer (NMLS #2389954).
Editorial Disclosure: This article is published by Mortgage & Real Estate Strategist Magazine for informational and educational purposes. It does not constitute legal, tax, financial, or investment advice. Mortgage and real estate professionals should consult appropriate experts and verify current program guidelines before making decisions based on this content.
Sources & References
- U.S. Bureau of Economic Analysis, Gross Domestic Product, Third Quarter 2026 Advance Estimate
- Board of Governors of the Federal Reserve System, Summary of Economic Projections and monetary policy communications, 2026
- Federal Reserve Bank of New York, Yield Curve Recession Probability Model, 2026
Sources Last Verified: November 8, 2026
Publisher & Mortgage Strategist
Ebonie Beaco is the founder and publisher of Mortgage & Real Estate Strategist Magazine. She is a licensed mortgage loan officer (NMLS #2389954) affiliated with NEXA Lending (NMLS #1660690), providing lending services in multiple states. She covers mortgage strategy, lending programs, and real estate investing.
Read More Articles by Ebonie Beaco